BIKE MONITOR
The cycling data portal for CITY CYCLING municipalities in Germany
Where are lots of cyclists on the roads? Where do they have to wait a long time? And which routes do they tend to avoid? The BIKE MONITOR cycling data portal allows you to determine where cycling goes smoothly in your local traffic network and where improvements are perhaps needed. The data is based on the journeys cyclists track using the CITY CYCLING app. We analyse these scientifically in collaboration with the TU Dresden.
We present the cycling data in clear formats to help answer planning questions and allow you to improve the local cycling infrastructure effectively with targeted measures.
Meaningful information for better cycling infrastructure
The versatile layers (on the BIKE MONITOR map) grant in-depth insights and analyse the behaviour of cyclists in German municipalities. The following layers can currently be viewed in the BIKE MONITOR portal:
- traffic volumes
- speeds
- heat map
- origin-destination traffic
- waiting times
- separate statistics area
Further map layers are currently being developed.
The data is updated every year, at the end of the campaign season. Currently, data is only available for German municipalities participating in CITY CYCLING.
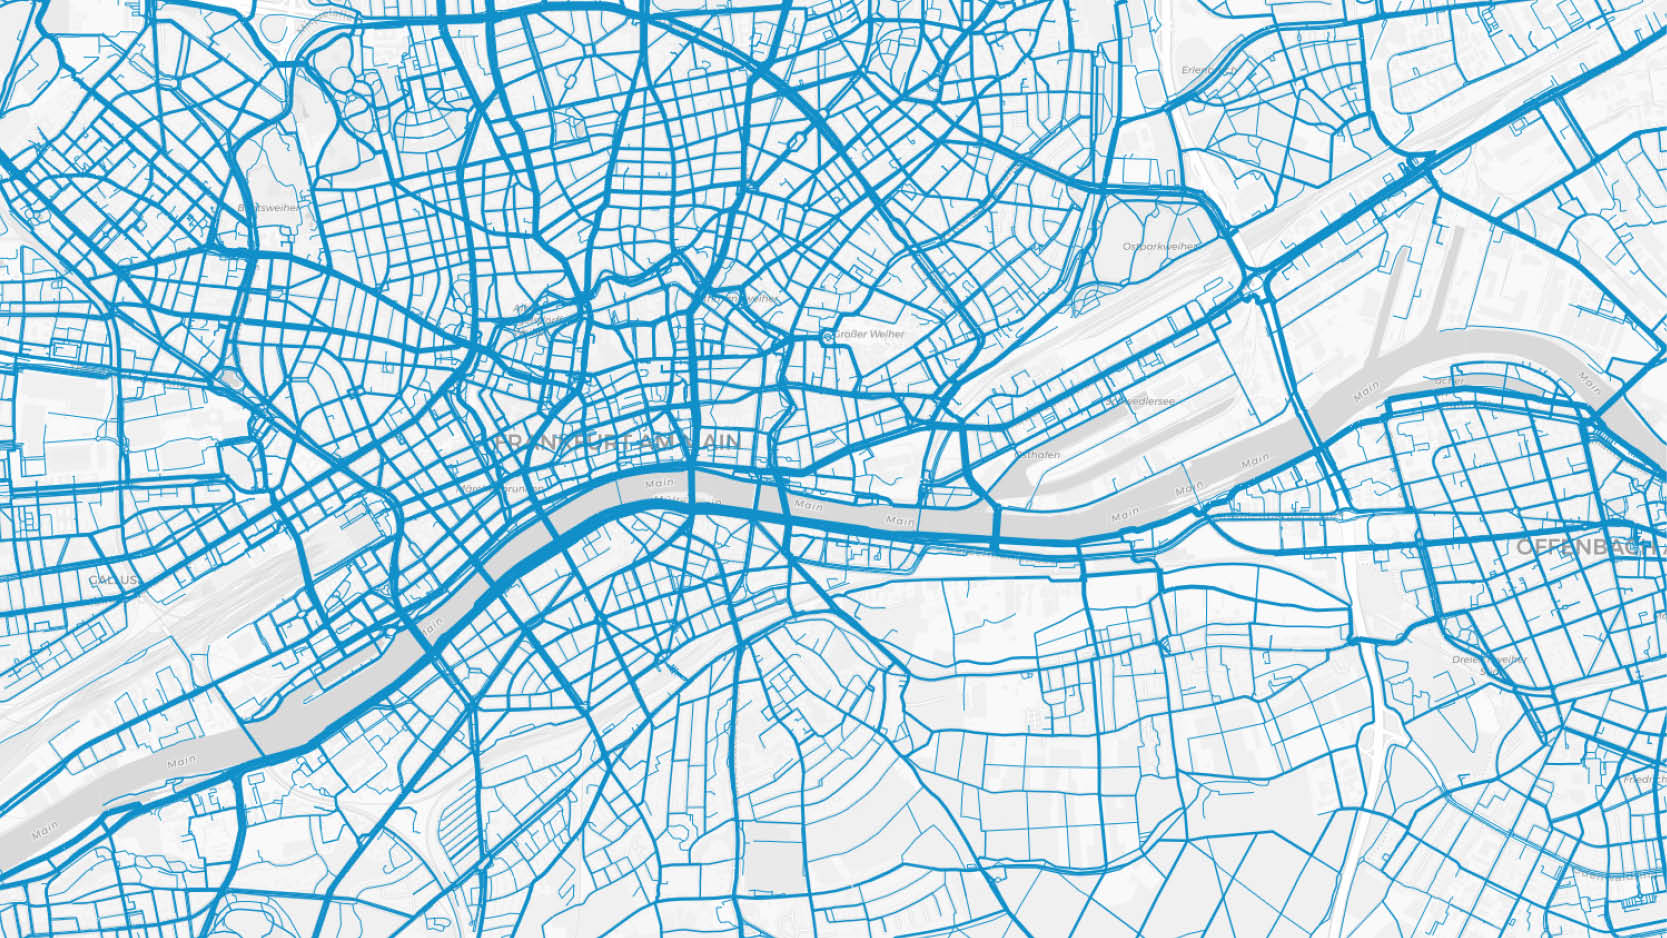
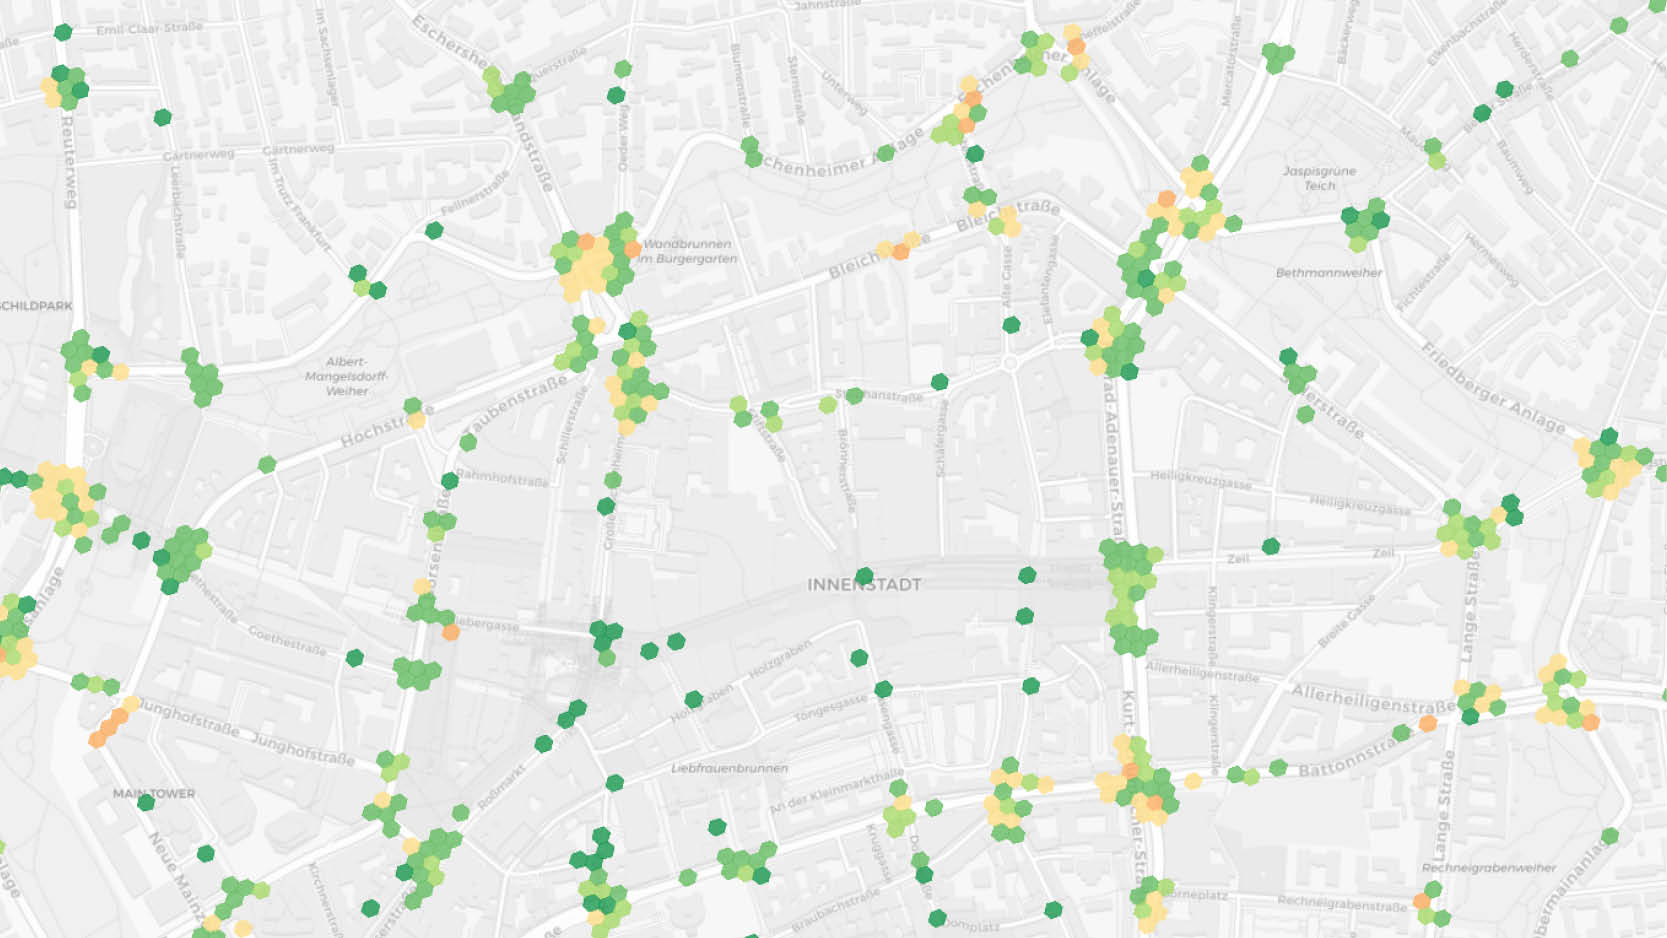
Traffic volumes – how many cyclists use which routes?
Traffic volumes – how many cyclists use which routes?
The traffic volume map shows all journeys completed by bike during the CITY CYCLING campaign. The GPS trajectories of the individual journeys are projected onto the local road network. A total number of journeys per segment is then aggregated for the number of times a route segment is crossed.
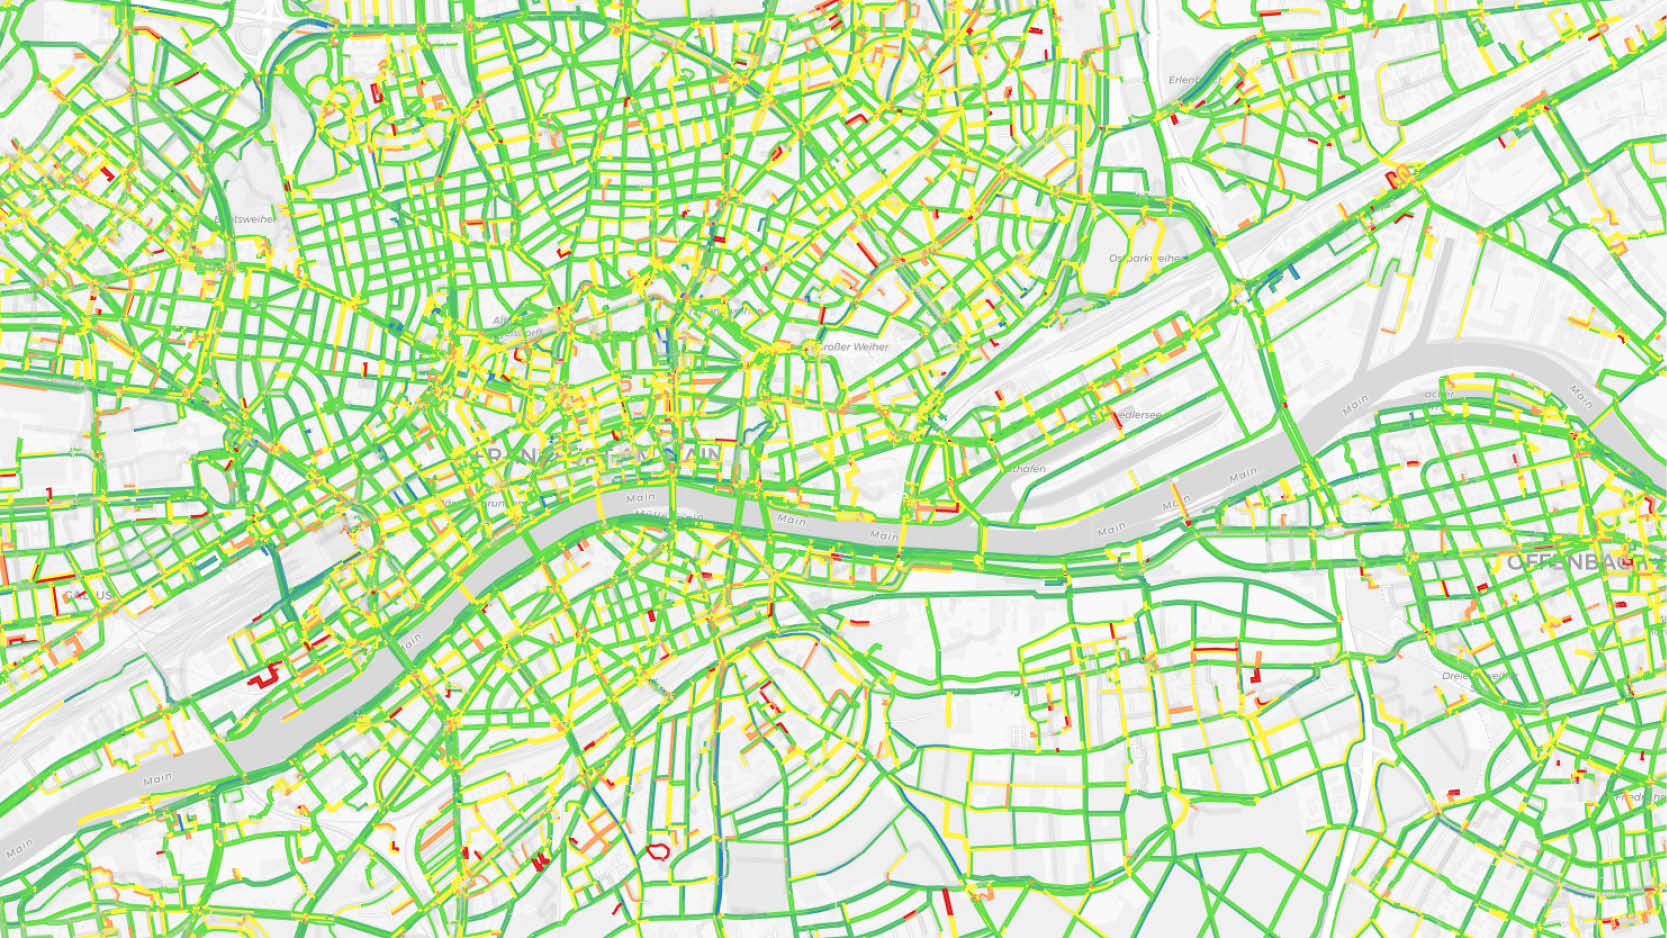
Speeds – how fast are cyclists travelling?
Speeds – how fast are cyclists travelling?
The speeds cyclists are travelling in a municipality are an important indicator of the local traffic quality. This map layer allows sections to be identified where cyclists are travelling slower. Allowing you to then check whether a poor road surface or other restrictions are hindering cyclists’ progress, for example. It is also possible to discern any differences in the speeds that cyclists travel on routes shared with pedestrians.
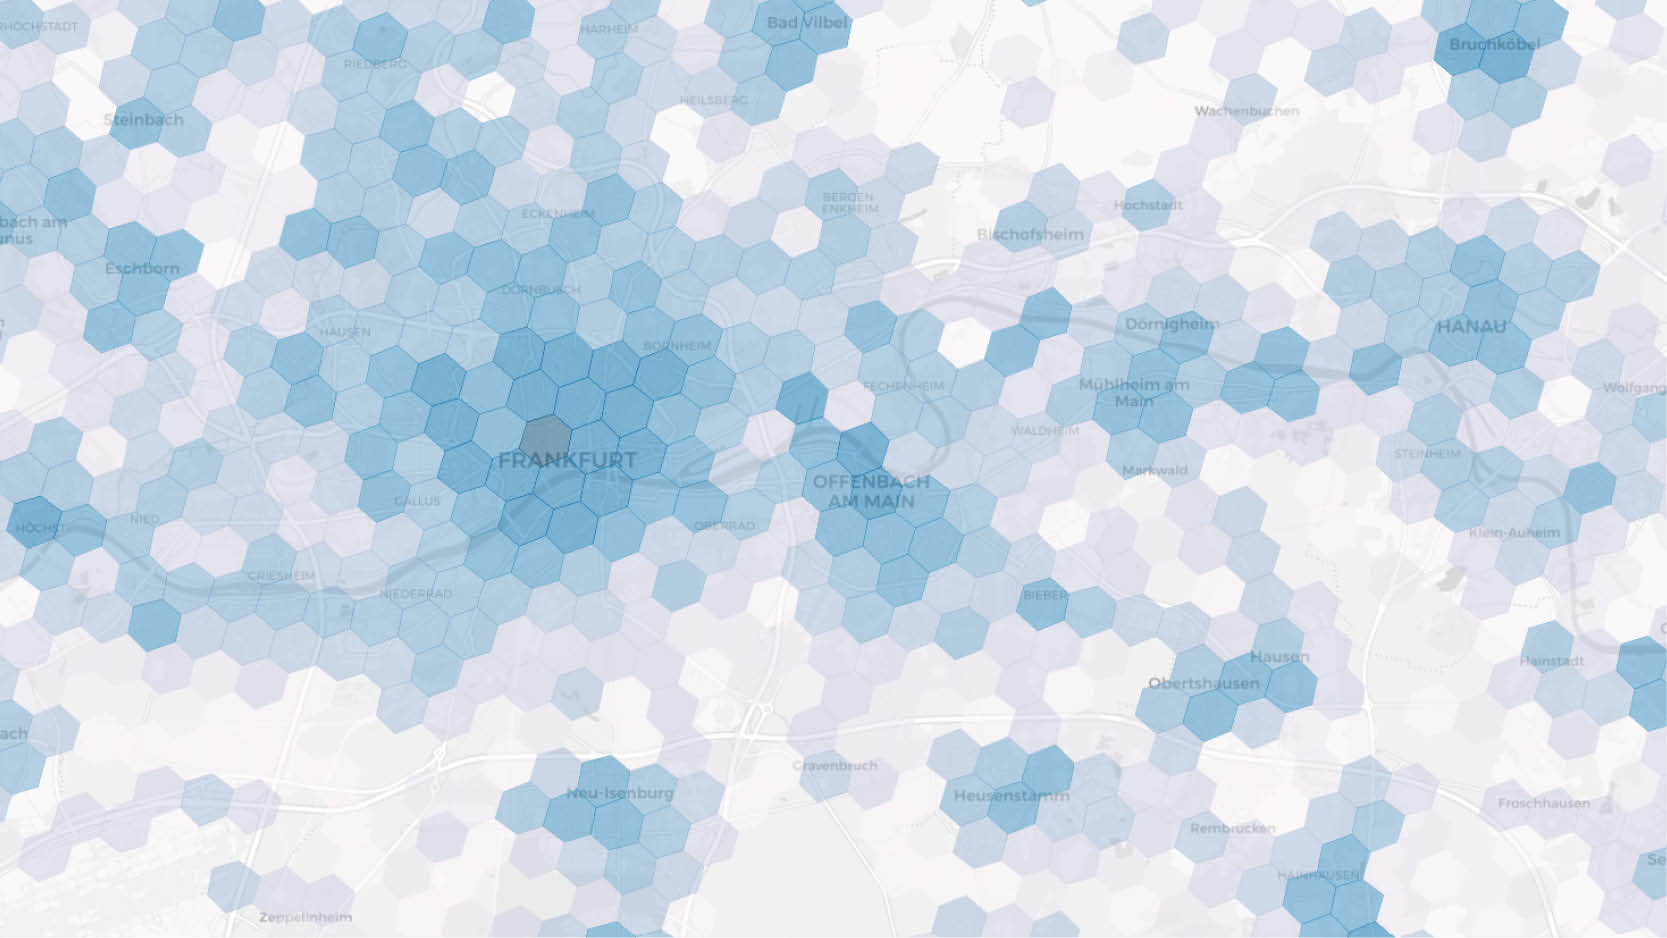
Heat map – distribution of bicycle traffic in municipalities
Heat map – distribution of bicycle traffic in municipalities
The GPS points of journeys completed by bike are overlaid on a map. The more GPS points are concentrated on one place, the brighter the points appear. Gain a preliminary overview of the distribution of cycling traffic in urban areas. The heat map also shows all journeys off the most popular routes, hence it is an important additional tool for interpreting the other analyses.
Origin-destination traffic – where do people cycle from/to?
Origin-destination traffic – where do people cycle from/to?
The CITY CYCLING data is used to show the distribution of bicycle traffic in an area. Understanding the origins and destinations of bicycle traffic can help in the planning of parking facilities or provide a fundamental understanding of the important origins and destinations of bicycle traffic, for example.
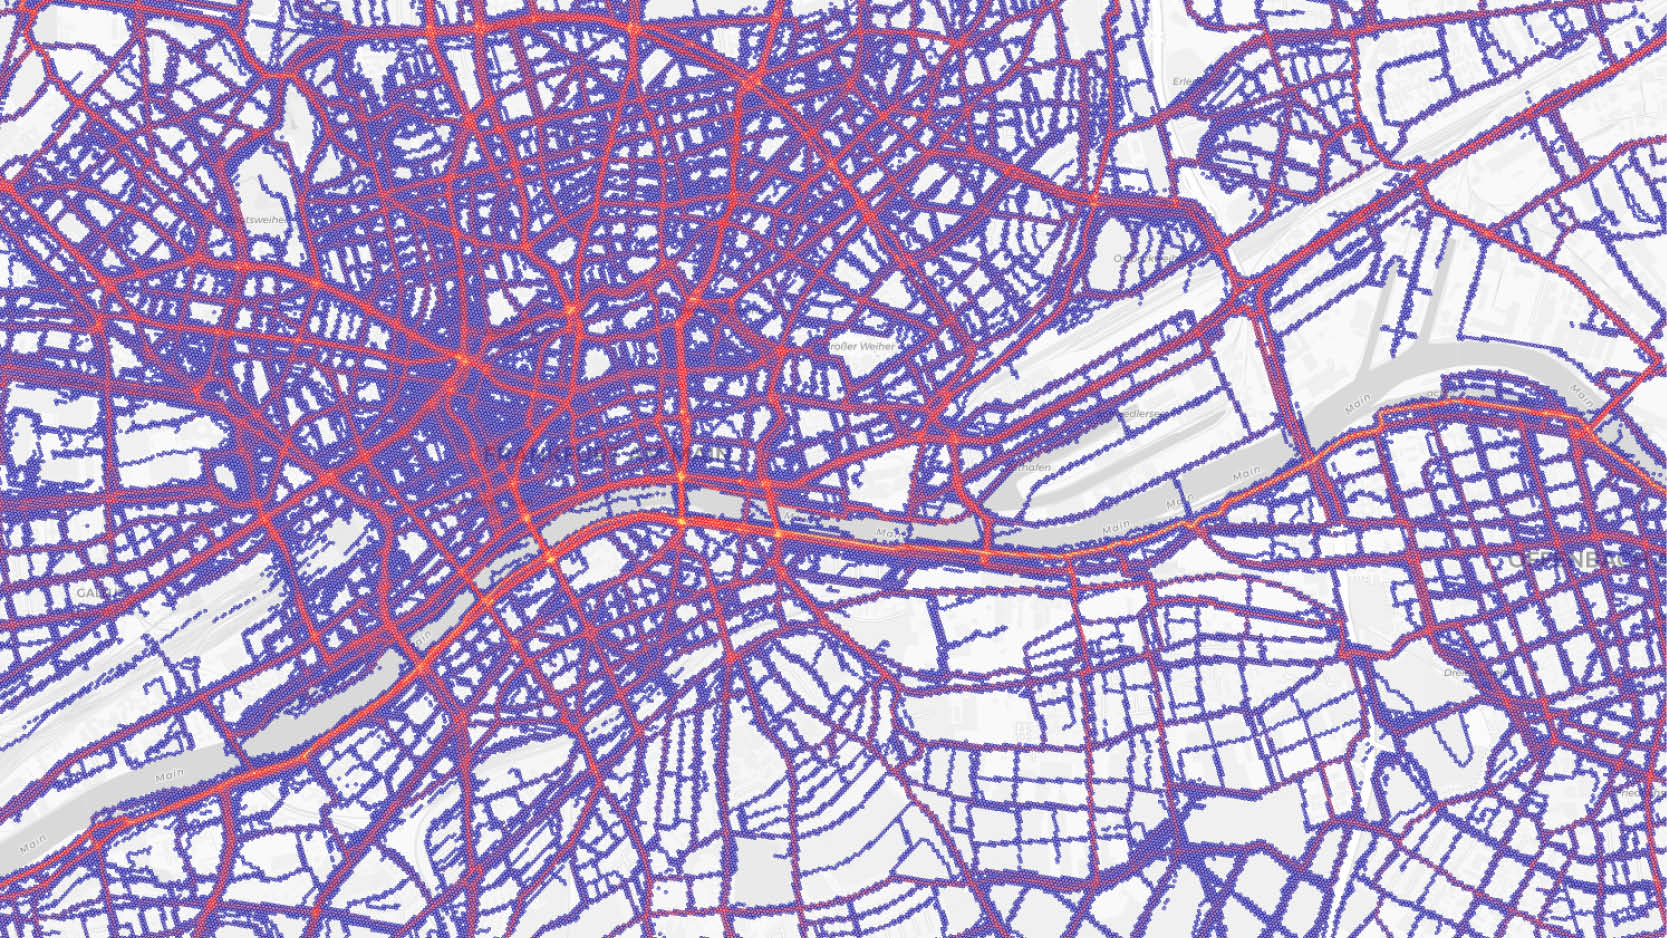
Waiting times – where does traffic come to a standstill?
Waiting times – where does traffic come to a standstill?
Waiting times also play an important role in determining the quality of journeys completed by bike. The BIKE MONITOR provides an overview of the crossroads in each municipality and shows exactly where cyclists have to wait particularly long. Allowing evaluations of how these waiting times can be reduced.
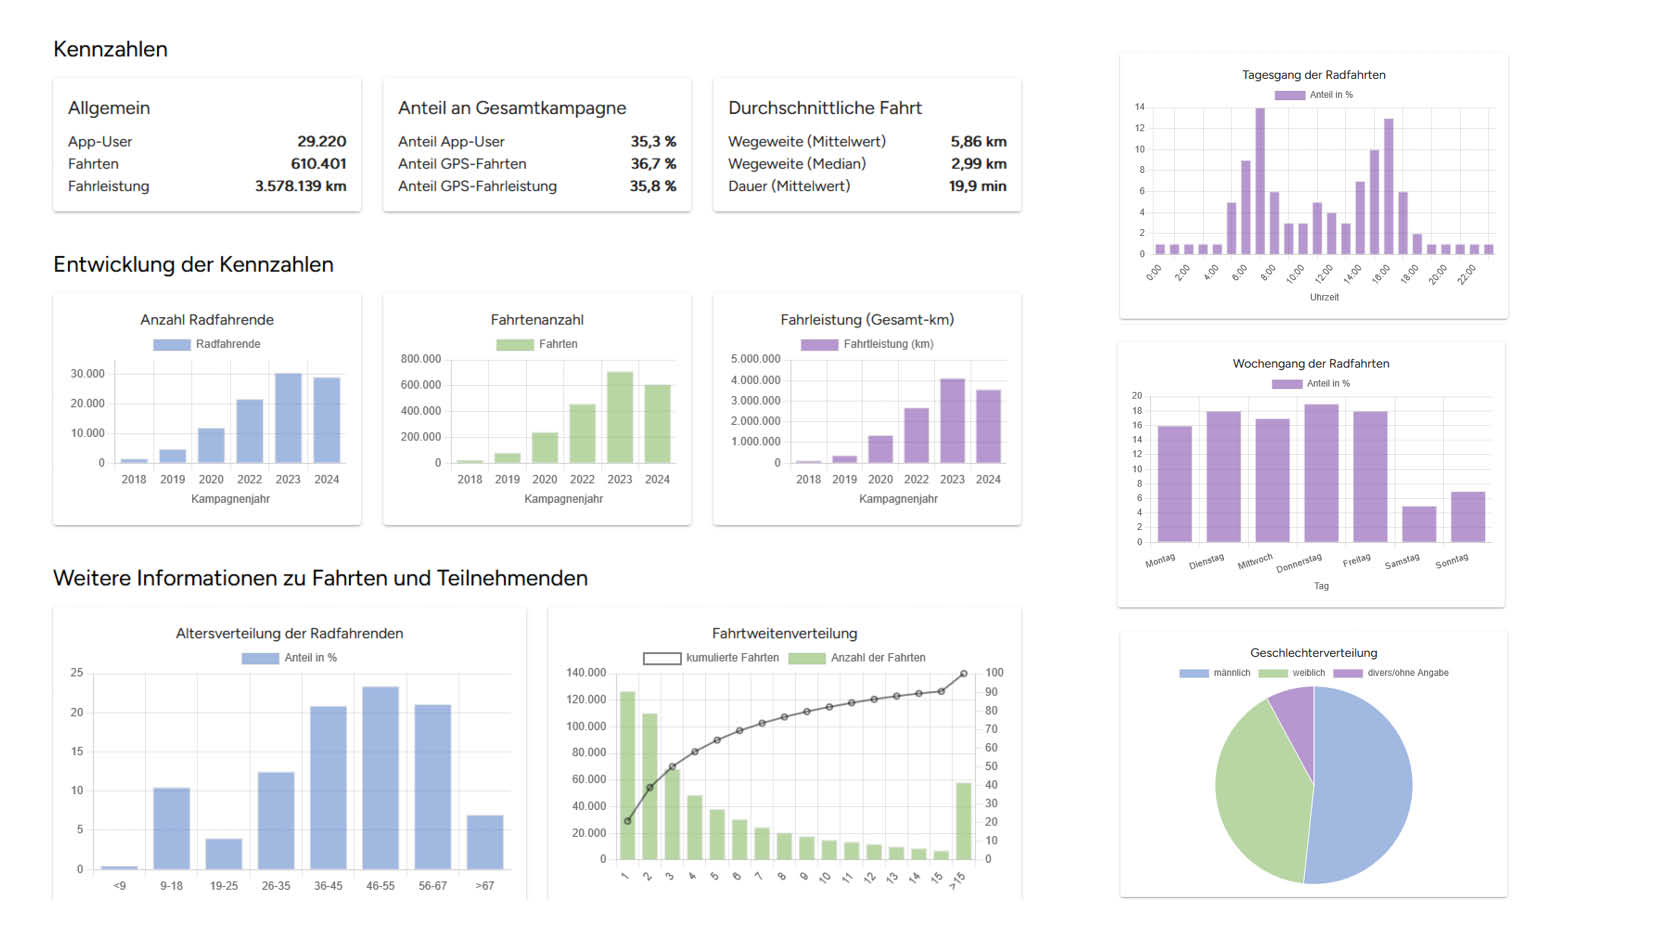
Statistics – what does the data tell us?
Statistics – what does the data tell us?
To be able to interpret the data properly and draw the correct conclusions, we need more information about the data collected. The statistics section provides additional anonymised information, clarifying the scope and quality of the underlying data and allowing the findings to be taken into account accordingly.
1. Participate in CITY CYCLING as a municipality!
Demonstrate your commitment to the mobility transition and invite local citizens to participate in CITY CYCLING. Municipalities need to register online at city-cycling.org/register.
2. Promote the CITY CYCLING app in your municipality!
Using the CITY CYCLING app to record routes is the easiest way for cyclists to add kilometres to their cycle log during the local campaign. This data also forms the basis of the BIKE MONITOR – so of your future traffic planning. Android and iOS versions of the CITY CYCLING app are available for download.

3. Use the BIKE MONITOR!
Use the data from the BIKE MONITOR and its maps for targeted expansion of your local cycling infrastructure.
Interested?
For more information or to contact us, see bike-monitor.de.